Directions: The following line diagram represents the yearly sales figure of a company in the years 2001-2010. Examine the diagram and answer the questions. 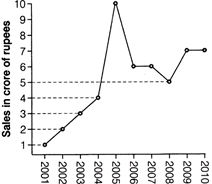 |
A) 5.2
B) 5
C) 6
D) 5.5
Correct Answer: A
Solution :
| [a] Average sales of the company \[\text{=}\frac{\text{Total sales of the company}}{\text{Number}\,\,\text{of}\,\,\text{years}}\] \[=\frac{2+2+3+4+10+6+6+5+7+7}{10}\] \[=\frac{152}{10}=\text{Rs}.\,5.2\,\text{crore}\] |


You need to login to perform this action.
You will be redirected in
3 sec

