Directions: Study the following graph and answer the questions. [SSC CGL Tier II, 2015] The following graph shows production (in thousands) of two type (P and Q) of vehicles by a factory over the years 2009 to 2014. 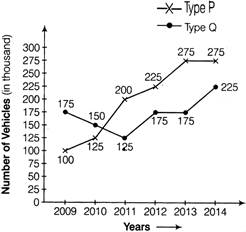 |
A) 14.3
B) 10.1
C) 16.7
D) 12.5
Correct Answer: C
Solution :
| [c] Required toss percentage\[=\frac{150-100}{150}\times 100\] \[=\frac{25\times 100}{150}=16.7%\] |


You need to login to perform this action.
You will be redirected in
3 sec

