| PASSAGE for question |
| Study, the bar chart and answer the questions based on it. |
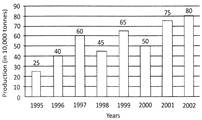
| Production of fertilizers by a company (in 10,000 tonnes) over the Years is shown in the following bar chart: |
 |
A) 2000 and 2001
B) 1999 and 2000
C) 1998 and 2000
D) 1995 and 2001
E) None of these
Correct Answer: D
Solution :
Explanation Average production (in 10000 tonnes) of 1996 and 1997 \[=\,\,\frac{40+60}{2}\,\,=\,\,50\] We shall find the average production (in 10000 tonnes) for each of the given alternative pairs: 2000 and 2001 \[=\,\,\,\frac{50+75}{2}=62.5\] 1999 and 2000 \[=\,\,\,\frac{65+50}{2}=57.5\] 1998 and 2000 \[=\,\,\,\frac{45+50}{2}=47.5\] 1995 and 2001 \[=\,\,\,\frac{25+75}{2}=50\] \[\therefore \] The average production of 1996 and 1997 is equal to the average production of 1995 and 2001.


You need to login to perform this action.
You will be redirected in
3 sec

