| PASSAGE for question |
| Study, the bar chart and answer the questions based on it. |
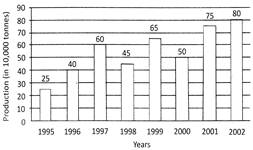
| Production of fertilizers by a company (in 10,000 tonnes) over the Years is shown in the following bar chart: |
 |
A) 1
B) 2
C) 3
D) 4
E) None of these
Correct Answer: D
Solution :
Explanation Average production (in 10,000 tonnes) over the given years \[=\,\,\frac{1}{8} \left( 25 + 40 + 60 + 45 + 65 + 50 + 75 + 80 \right) = 55\]\[\therefore \] The productions during the years 1997, 1999, 2001 and 2002 are more than the average production.


You need to login to perform this action.
You will be redirected in
3 sec

