| Study the following bar graph and answer the given questions. |
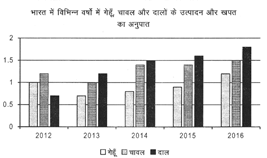 |
| If in the year 2013 the production of rice is 15 ton and in the year 2014 the consumption of pulses is 14 ton. Find the ratio between consumption of rice in the year 2013 and production of pulses in the year 2014. |
A) \[7:5\]
B) \[5:7\]
C) \[4:5\]
D) \[9:7\]
E) \[7:9\]
Correct Answer: B


You need to login to perform this action.
You will be redirected in
3 sec

