| Study the following information carefully to answer the questions asked. | ||||||||||||||||||
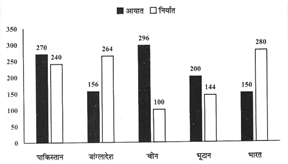
| The following bar graph represents the exports (in Cr Rs.) and imports (in Cr Rs.) of five countries in 2016. | ||||||||||||||||||
 | ||||||||||||||||||
|
A) 112.57%
B) 108.59%
C) 106.22%
D) 123.15%
E) 119.62%
Correct Answer: C


You need to login to perform this action.
You will be redirected in
3 sec

