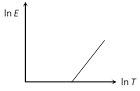
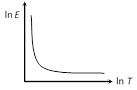
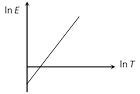
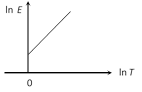
JEE Main & Advanced Physics Transmission of Heat Question Bank Graphical Questions

  • question_answer
    Which of the following graphs correctly represents the relation between ln E and ln T where E is the amount of radiation emitted per unit time from unit area of a body and T is the absolute temperature                            [DCE 2002]

    A)                       

    B)                 

    C)                       

    D)  

    Correct Answer: D

    Solution :

                       According to Stefan's law \[E=\sigma {{T}^{4}}\]                    \[\Rightarrow \log E=\log \sigma +4\log T\]\[\Rightarrow \log E=4\log T+\log \sigma \]                    on comparing this equations with  \[y=mx+C\]            we find that graph between log E and log T will be a straight line, having positive slope (m = 4) and intercept on log E axis equal to \[\log \sigma \] 


You need to login to perform this action.
You will be redirected in 3 sec spinner