A) P
B) Q
C) R
D) S
Correct Answer: B
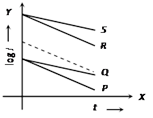
Solution :
In case of RC circuit \[i=\frac{E}{R}{{e}^{-t/RC}}\] \ \[{{\log }_{e}}i=-\frac{t}{RC}+{{\log }_{e}}\frac{E}{R}\] When R is doubled, the slope of the curve increases. Further at t = 0, the current will be less for an increased value of resistance.


You need to login to perform this action.
You will be redirected in
3 sec

