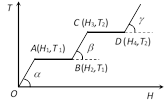
A) \[{{T}_{2}}\] is the melting point of the solid
B) BC represents the change of state from solid to liquid
C) \[({{H}_{2}}-{{H}_{1}})\] represents the latent heat of fusion of the substance
D) \[({{H}_{3}}-{{H}_{1}})\] represents the latent heat of vaporization of the liquid
Correct Answer: C
Solution :
Since in the region AB temperature is constant therefore at this temperature phase of the material changes from solid to liquid and (H2 ? H1) heat will be absorb by the material. This heat is known as the heat of melting of the solid. Similarly in the region CD temperature is constant therefore at this temperature phase of the material changes from liquid to gas and (H4 ? H3) heat will be absorb by the material. This heat as known as the heat of vaporisation of the liquid.


You need to login to perform this action.
You will be redirected in
3 sec

