JEE Main & Advanced Physics Thermometry, Calorimetry & Thermal Expansion Question Bank Graphical Questions

  • question_answer
    A solid substance is at 30°C. To this substance heat energy is supplied at a constant rate. Then temperature versus time graph is as shown in the figure. The substance is in liquid state for the portion (of the graph)                            [RPET 1990, 94]

    A)            BC 

    B)            CD

    C)            ED 

    D)            EF

    Correct Answer: B

    Solution :

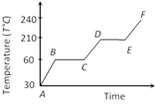
               In the given graph CD represents liquid state.


You need to login to perform this action.
You will be redirected in 3 sec spinner