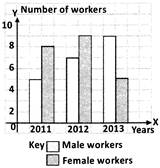
 Calculate the difference between the total number of male and female workers employed over those three years.
A) \[1\]
B) \[2\]
C) \[4\]
D) \[6\]
Correct Answer: A
Solution :
The total number of male workers employed \[=5+7+9=21\] The total number of female workers employed \[=8+9+5=22\] \[\therefore \] The required difference \[=22-21=1\]


You need to login to perform this action.
You will be redirected in
3 sec

