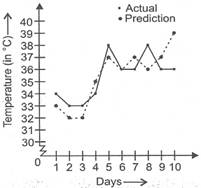
 On what day, the graph shows the maximum deviation of actual temperature from the forecast?
A) Day 10
B) Day 8
C) Day 5
D) Day 4
Correct Answer: A
Solution :
On day 10, graph shows, deviation of\[\text{3 }\!\!{}^\circ\!\!\text{ C}\].


You need to login to perform this action.
You will be redirected in
3 sec

