| DIRECTION: The following graph shows the temperature of a patient admitted in a hospital, recorded every 2 hours. |
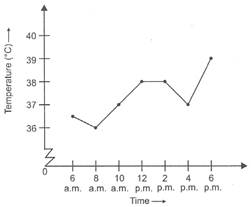 |
A) 10 a.m.
B) 6 p.m.
C) 4 p.m.
D) 2 p.m.
Correct Answer: B


You need to login to perform this action.
You will be redirected in
3 sec

