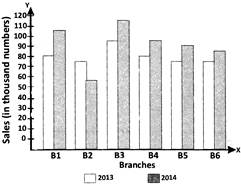
 What percent of the average sales of branches \[{{B}_{1}},{{B}_{2}}\] and \[{{B}_{3}}\] in 2014 is the average sales of branches \[{{B}_{1}},{{B}_{3}}\] and \[{{B}_{6}}\] in 2013?
A) \[75%\]
B) \[77.5%\]
C) \[91%\]
D) \[87.5%\]
Correct Answer: C
Solution :
Not Available


You need to login to perform this action.
You will be redirected in
3 sec

