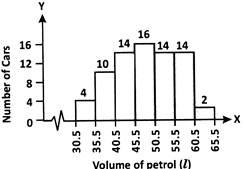
 How many cars consume less than \[40.5\,l\] of petrol per week?
A) \[4\]
B) \[14\]
C) \[0\]
D) \[6\]
Correct Answer: B
Solution :
The number of cars that consume less than \[40.5\,l\] of petrol per week\[=4+10=14\].


You need to login to perform this action.
You will be redirected in
3 sec

