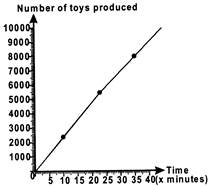
 Find the expected time to complete producing 8000 toys if the production starts at \[3.45\] p.m.
A) \[3:50\,p.m\]
B) \[4:20\,p.m\]
C) \[4:15\,p.m\]
D) \[4:35p.m\]
Correct Answer: B
Solution :
Not Available


You need to login to perform this action.
You will be redirected in
3 sec

