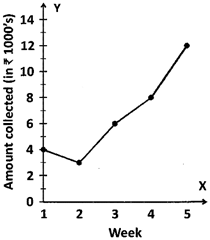
 Between which two consecutive weeks is the increase in amount of money collected the maximum?
A) 2 and 3
B) 1 and 2
C) 4 and 5
D) 3 and 4
Correct Answer: C
Solution :
Not Available


You need to login to perform this action.
You will be redirected in
3 sec

