| Directions The next three questions are based on the given graph. Look at the graph given below wherein the figures are arranged as A, B, C, D and E starting from the left respectively. |
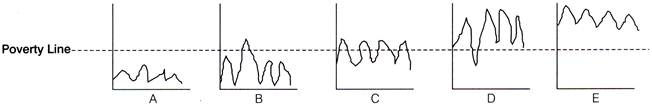 |
| Which of the following figure represents the situation of churning poor? |
A) Figure A
B) Figure B
C) Figure C
D) Figure D
Correct Answer: C
Solution :
Figure C


You need to login to perform this action.
You will be redirected in
3 sec

