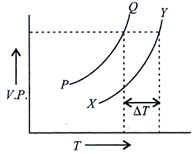
| In the graph plotted between vapour pressure (V.P.) and temperature \[\left( \Delta T \right)\], |
 |
A) PQ is the curve for solvent, XY is the curve of solution and \[\Delta T\] is depression in freezing point
B) PQ is the curve for solution, XY is the curve for solvent and \[\Delta T\] is elevation in boiling point
C) PQ is the curve for solvent, XY is the curve for solution and \[\Delta T\] is molal elevation in boiling point
D) PQ is the curve for solvent, XY is the curve for solution and \[\Delta T\] is elevation in boiling point.
Correct Answer: D
Solution :
PQ corresponds to increase in vapour pressure of solvent with temperature and XY corresponds to increase in vapour pressure of solution with temperature. \[\Delta T\] is the elevation in boiling point of a solution.


You need to login to perform this action.
You will be redirected in
3 sec

