| DIRECTION : The picture graph shows the types of colours various children prefer. Study the graph and answer the following questions. |
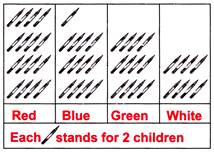 |
A) 40
B) 20
C) 48
D) 34
Correct Answer: A
Solution :
Number of children who prefer green colour = 24 Number of children who prefer white colour =16 \[\therefore \] Number of children who prefer green and white colour together = 24 + 16 = 40


You need to login to perform this action.
You will be redirected in
3 sec

