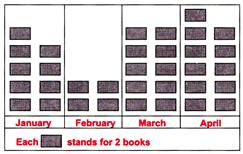
| DIRECTION : The figure shows the number of books sold by a leading book store in 4 different months. Study the graph and answer the following questions. |
 |
A) 8
B) 26
C) 20
D) 10
Correct Answer: D
Solution :
Number of books sold in January =18 Number of books sold in February = 8 \[\therefore \] Number of books sold in January more than in February \[=18-8=10\]


You need to login to perform this action.
You will be redirected in
3 sec

