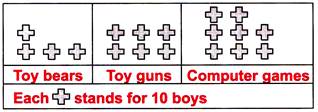
| DIRECTION : The picture graph shows the various types of toys some boys would like for Christmas. Study the graph and answer the given questions. |
 |
A) 20
B) 30
C) 10
D) 15
Correct Answer: A
Solution :
Number of boys prefer toy guns = 60 Number of boys prefer toy bears = 40 Number of boys prefer toy guns more than toy bears \[=\text{ }60\text{ }-\text{ }40\text{ }=\text{ }20\]


You need to login to perform this action.
You will be redirected in
3 sec

