A) Increases linearly with increasing temperature
B) Increases non-linearly with increasing temperature
C) Decreases linearly with increasing temperature
D) Decreases non-linearly with increasing temperature
Correct Answer: B
Solution :
[b] If we plot a graph between the vapour pressure and the temperature. We would get a curve that rises faster as T increases, giving a curved line.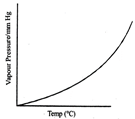


You need to login to perform this action.
You will be redirected in
3 sec

