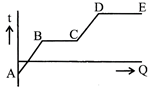
 The graph given above indicates change in temperature (\[\Delta t\]) when heat (\[Q\]) was given to a substance. Which among the following parts of the graph correctly depict the latent heat of the substance? [NDA]
A) AB and BC
B) BC and DE
C) CD and DE
D) DE and AB
Correct Answer: C
Solution :
Not Available


You need to login to perform this action.
You will be redirected in
3 sec

