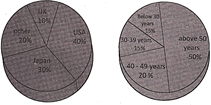
| Directions: The given pie charts exhibit the distribution of the overseas tourist traffic from India. The two charts shows the tourist distribution by country and the age profiles of the tourists respectively. |
| Distribution of Overseas Tourist Traffic from India. |
 |
A) 40%
B) 50%
C) 60%
D) 70%
E) None of these
Correct Answer: B
Solution :
Explanation Option [b] is correct. \[\left( 40+10 \right)=50%\] (from first chart)


You need to login to perform this action.
You will be redirected in
3 sec

