A) Empirical relationship between mean, median, mode is 3 median = 2 mean + mode
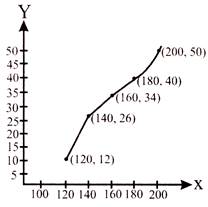
B) The above given graph shows a more than ogive
C) First quartile \[{{Q}_{1}}=\left( \frac{n+1}{4} \right)th\] term when n is even and n is number of observations.
D) For individual data, second quartile, \[{{Q}_{2}}=median\].
Correct Answer: C
Solution :
(c): \[{{Q}_{1}}={{\left( \frac{n+1}{4} \right)}^{th}}\] term when n = odd


You need to login to perform this action.
You will be redirected in
3 sec

