| (i) Marginal Revenue (MR) and Total Revenue (TR) |
| (ii) Marginal Revenue (MR) and Average Revenue (AR). |
Answer:
(i) Relationship between Marginal Revenue (MR) and Total Revenue (TR) is explained below: [a] When MR is positive (i.e., greater than zero), TR rises. [b] When MR becomes zero, TR is maximum. [c] When MR becomes negative, TR starts to fall.  Total and Marginal Revenue Curves (ii) Relationship between Marginal Revenue (MR) and Average Revenue (AR) is explained below: [a] When both AR and MR are falling, MR falls at a greater rate than AR. In other words, if AR and MR are downward sloping curves, MR curve always remain below the AR curve. This is the case under monopoly or monopolistic competition market. [b] MR can be negative but AR is always positive (i.e., greater than zero). That is why, AR curve always remains above the X-axis while MR curve can go below the X-axis. [c] If AR becomes constant, MR also becomes equal to AR. In this situation, AR and MR are the same curves and parallel to the X-axis. This is the case in perfect competition.
 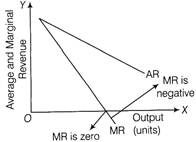 Marginal and Average Revenue Curves Or The following relationship is observed between total product and marginal product:
 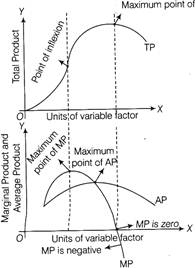 From the above curves, following observations are made on the relationship between TP and MP: (i) When TP increases at an increasing rate, MP also increases. (ii) When TP increases at a diminishing rate, MP declines. (iii) When TP reaches its maximum, MP becomes zero. (v) When TP begins to decline, MP becomes negative.


You need to login to perform this action.
You will be redirected in
3 sec

