| A consumer's budget is Rs.50. He is buying good 1 and good 2. The price of good 1 is Rs.12 per unit and of good 2 is Rs.5 per unit. Draw a budget on basis of information given and also explain the concept of Marginal Rate of Substitution (MRS), |
| or |
| Differentiate between increase in demand and expansion in demand. |
Answer:
A consumer with his given income of Rs.50 can buy 25 units of good 1 or 10 units of good 2. So, the required co-ordinates are (0, 10) and (25, 0) and ab is the required budget line. The coordinates are computed as follows: Assuming that the consumer spends his total income to purchase good 1 then he can purchase 25 units (50-2) of good 1. His consumption bundle = (25, 0) Assuming that the consumer spends his total income to purchase Good 2, then he can purchase 10 units (50+5) of Good 2. His consumption bundle = (0, 10). Each point on the line ab indicates different combinations of good 1 and good 2 which a consumer can buy with his given income.  Diagram Showing Budget Line Marginal Rate of Substitution (MRS) It refers to the rate at which the consumer is willing to substitute good X for good Y. It is expressed as \[\frac{Units\,of\,Good\,Y\,Sacrifices(\Delta Y)}{Units\,of\,Good\,X\,Gained(\Delta X)}\] Differences between increase in demand and expansion in demand are:
Basis
Increase in Demand
Expansion in Demand
Reason
This is caused by change in determinants other than own price of the commodity
This is caused by change in own price of the commodity.
Impact
This happens when at the same price more is being demanded.
This happens when at a lower price, more is being demanded.
Effect on demand curve
It results in rightward shift is demand curve.
It results in rightward movement on the same demand curve
Diagrammatic presentation
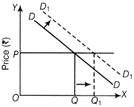 Quantity (units) Shift in Demand Curve
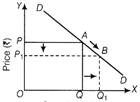 Quantity (units) Movement Along a Demand Curve


You need to login to perform this action.
You will be redirected in
3 sec

