
Directions (Q. 1 - 5): Study the following pie-charts and table carefully to answer the questions given below: The pie-charts show the percentage of candidates who secured qualifying marks in SSC-CGL and IBPS PO in 2016 from different cities. 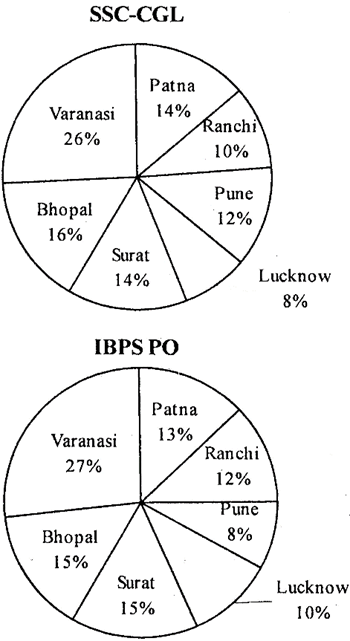 The following table shows the ratio of the number of male to female candidates who secured qualifying marks from different cities.
| City | SSC CGL | IBPS PO |
| Male : Female | Male : Female | |
| Patna | 3:2 | 4:5 |
| Ranchi | 1:3 | 4:7 |
| Pune | 2:3 | 7:9 |
| Lucknow | 5:7 | 2:2 |
| Surat | 9:7 | 3:7 |
| Bhopal | 4:3 | 6:1 |
| Varanasi | 3:5 | 1:5 |
A) Ranchi
B) Pune
C) Patna
D) Bhopal
E) Lucknow
Correct Answer: C
Solution :
Required % for Patna\[=100\times \frac{3}{5}=60%\](highest) Required % for Ranchi\[=100\times \frac{1}{4}=25%\] Required % for Pune\[=100\times \frac{2}{5}=40%\] Required % for Lucknow\[=100\times \frac{5}{12}=41.66%\] Required % for Surat\[=100\times \frac{9}{16}=56.25%\] Required % for Bhopal\[=100\times \frac{4}{7}=57.14%\] Required % for Varanasi\[=100\times \frac{3}{8}=37.5%\]





You need to login to perform this action.
You will be redirected in
3 sec