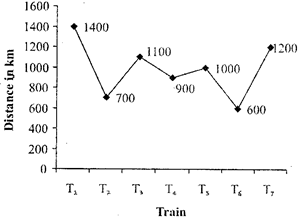
Direction: The line graph shows the distance covered by different trains in km and the data in the table shows the time taken by different trains to cover the distance (in hours).
 Time taken by different trains in hours
| Train | Time |
| \[{{T}_{1}}\] | 30 hours |
| \[{{T}_{2}}\] | 9 hours 40 minutes |
| \[{{T}_{3}}\] | 17 hours 30 minutes |
| \[{{T}_{4}}\] | - |
| \[{{T}_{5}}\] | 21 hours 36 minutes |
| \[{{T}_{6}}\] | - |
| \[{{T}_{7}}\] | - |
A) 352 : 315
B) 315 : 352
C) 11 : 9
D) 9 : 11
E) 111 : 219
Correct Answer: A
Solution :
Time taken by train\[{{T}_{3}}=17\frac{1}{2}\]hours Time taken by train\[{{T}_{4}}\] \[=17\frac{1}{2}-1\frac{1}{2}=16\,\]hours Reqd ratio = Speed of train \[{{T}_{3}}\]: Speed of train \[{{T}_{4}}\] \[=\frac{1100\times 2}{35}:\frac{900}{16}=352:315\]


You need to login to perform this action.
You will be redirected in
3 sec

