Direction: Study the pie-chart, line graph and table carefully and answer the given questions. The pie-chart shows the percentage of students of different colleges. The total number of students of all colleges is 25000.
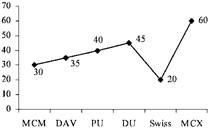
 The line graph shows the percentage of females in each college.
 The table shows the number of students who appeared in an examination and the ratio of the number of students who qualified to that of those who did not qualify from different colleges.
| College | Appeared | Qualified : Not Qualified |
| MCM | 84% | 5 : 1 |
| DAV | 83% | 3 : 2 |
| PU | 88% | 11 : 4 |
| DU | 92% | 9 : 3 |
| Swiss | 96% | 3 : 1 |
| MCX | 90% | 17 : 8 |
A) MCM
B) DAV
C) PU
D) MCX
E) Swiss
Correct Answer: E
Solution :
| College | Total students | Male students | Female students | Appeared students | Qualified | Not Qualified |
| MCM | 5250 | 3675 | 1575 | 4410 | 3675 | 735 |
| DAV | 5500 | 3575 | 1925 | 4565 | 2739 | 1826 |
| PU | 2250 | 1350 | 900 | 1980 | 1452 | 528 |
| DU | 3000 | 1650 | 1350 | 2760 | 2070 | 690 |
| Swiss | 4250 | 3400 | 850 | 4080 | 3060 | 1020 |
| MCX | 4750 | 1900 | 2850 | 4275 | 2907 | 1368 |


You need to login to perform this action.
You will be redirected in
3 sec

