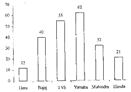
| Direction: Study the following bar graph and pie-chart carefully and answer the questions given below: The bar graph shows the sales of six different brands of bike manufacturers in 2016 (in thousand units) in India. |
|
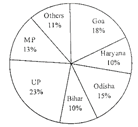
| The pie-chart shows the percentage sales of Yamaha in 2016 in different states of India. |
|
A) 7.05
B) 8.06
C) 6.02
D) 4.22
E) 5.33
Correct Answer: B
Solution :
Reqd difference = (23 - 10) % of 62 thousand \[=\frac{13\times 62000}{100}\] \[=620\times 13=8060=8.06thousand\]


You need to login to perform this action.
You will be redirected in
3 sec

