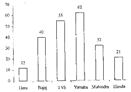
| Direction: Study the following bar graph and pie-chart carefully and answer the questions given below: The bar graph shows the sales of six different brands of bike manufacturers in 2016 (in thousand units) in India. |
|
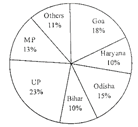
| The pie-chart shows the percentage sales of Yamaha in 2016 in different states of India. |
|
A) 1920015
B) 156732
C) 177131
D) 295765
E) 187100
Correct Answer: E
Solution :
Total sales of all bikes \[=\frac{115}{100}\times 222000\] = 255300 Sales of Yamaha in MP increases by 10% and % distribution remains the same for all other states, means overall % increase in all states together is the same as that in MP, ie 10%. \[\therefore \] New total sales of Yamaha \[=62000\left( \frac{110}{100} \right)\] = 68200 \[\therefore \] Reqd difference = 255300 - 68200 = 187100


You need to login to perform this action.
You will be redirected in
3 sec

