A)
B)
C)
D)
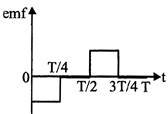
Correct Answer: A
Solution :
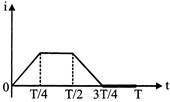
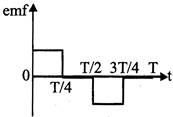
\[e=-L\frac{di}{dt}\] During 0 to \[\frac{T}{4},\frac{di}{dt}=\] const. \[\therefore \,\,\,e=-ve\] During \[\frac{T}{4}\]to \[\frac{T}{2},\frac{di}{dt}=0\] \[\therefore \,\,e=0\] During \[\frac{T}{2}\] to \[\frac{3T}{4},\frac{di}{dt}=\]const. \[\therefore \,\,\,e=+ve\] Thus graph given in option represents the variation of induced emf with time.


You need to login to perform this action.
You will be redirected in
3 sec

