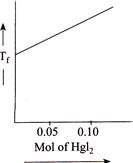
A)
B)
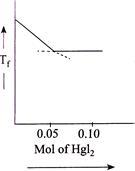
C)
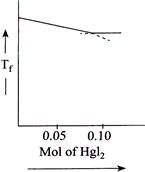
D)
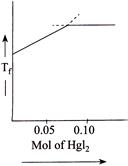
Correct Answer: B
Solution :
[b] When \[Hg{{I}_{2}}\] is added to \[KI\]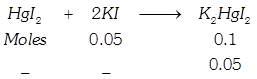 \[\Rightarrow \,\,0.05\] moles of \[Hg{{I}_{2}}\] are required for its complex reaction with \[KI\]. Thus, as \[Hg{{I}_{2}}\] is being added, the number of solute molecules will decrease causing \[\Delta {{T}_{f}}\]. to decrease \[\Rightarrow \] (Causing \[{{T}_{f}}\] to increase). When whole of \[KI\] has been converted to \[{{K}_{2}}Hg{{I}_{4}},\] further addition of \[Hg{{I}_{2}}\] does not change \[{{T}_{f}}\] since it is a sparingly soluble salt.


You need to login to perform this action.
You will be redirected in
3 sec

