A) \[{{V}_{1}}={{V}_{2}}={{V}_{3}}={{V}_{4}}\]
B) \[{{V}_{4}}>{{V}_{3}}>{{V}_{2}}>{{V}_{1}}\]
C) \[{{V}_{1}}={{V}_{2}},\,\,{{V}_{3}}={{V}_{4}}\] and \[{{V}_{2}}>{{V}_{3}}\]
D) \[{{V}_{1}}={{V}_{2}},\,\,{{V}_{3}}={{V}_{4}}\] and \[{{V}_{2}}<{{V}_{3}}\]
Correct Answer: C
Solution :
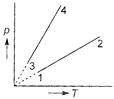
Straight line curve of p vs T shows that \[cI-m+an=0\] and , i.e., volume is constant. Moreover, higher the T and lesser the p, higher the value of V. Thus \[\frac{I}{ac+b}=\frac{m}{bc+a}=\frac{n}{1-{{c}^{2}}}\] or\[\frac{x}{ac+b}=\frac{y}{bc+a}=\frac{z}{1-{{c}^{2}}}\]


You need to login to perform this action.
You will be redirected in
3 sec

