A) \[{{V}_{1}}={{V}_{2}},\,\,{{V}_{3}}={{V}_{4}}\] and \[{{V}_{2}}>{{V}_{3}}\]
B) \[{{V}_{1}}={{V}_{2}},\,\,{{V}_{3}}={{V}_{4}}\] and \[{{V}_{2}}<{{V}_{3}}\]
C) \[{{V}_{1}}={{V}_{2}}={{V}_{3}}={{V}_{4}}\]
D) \[{{V}_{4}}>{{V}_{3}}>{{V}_{2}}>{{V}_{1}}\]
Correct Answer: A
Solution :
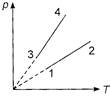
From ideal gas equation,\[pV=\mu RT\] Slope of p-T curve,\[\frac{p}{T}=\frac{\mu R}{V}\] or Slope \[\propto \,\frac{1}{V}\] It means lines of smaller slope represents greater volume of gas. For the figure given in problem, points 1 and 2 are on the same line, so they will represent same volume, i.e., \[{{V}_{1}}={{V}_{2}}\]. Similarly, points 3 and 4 are on the same line, so they will represent same volume, i.e., \[{{V}_{3}}={{V}_{4}}\]. Also, slope of line 1-2 is less than that of the line 3-4,hence \[({{V}_{1}}={{V}_{2}})\,>\,({{V}_{3}}={{V}_{4}})\].


You need to login to perform this action.
You will be redirected in
3 sec

