A) is on left of its mid-point
B) is on right of its mid-point
C) is coinciding with its mid-point
D) information is insufficient
Correct Answer: A
Solution :
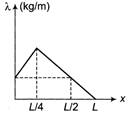
Idea The given graph is between mass per unit length versus length of rod. So, its area will give mass of rod and by analyzing mass distribution we can observe the position of centre of mass. Area under\[\lambda \]versus x curve gives mass. For any x and y area of I > area of II, it means more mass as on the left side, so centre of mass would be on left half.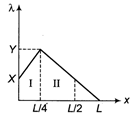 TEST Edge In this question linear mass density varies with\[\lambda =kx\].
 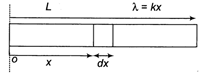 (k = positive constant) Let the mass of small area = dm, So, \[dm=\lambda dx=kxdx\] \[\Rightarrow \]So\[{{X}_{CM}}=\int_{0}^{L}{x}\,dm=\int_{0}^{L}{k{{x}^{2}}}dx\] \[=k\left( \frac{{{x}^{3}}}{3} \right)_{0}^{L}=\frac{k{{L}^{3}}}{3}\]


You need to login to perform this action.
You will be redirected in
3 sec

