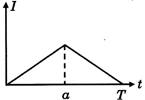
| The current I in an inductance coil varies with time t according to the graph shown in figure. Which one of the following plots shows the variation of voltage in the coil with time? |
 |
A)

B)
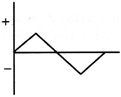
C)

D)

Correct Answer: C
Solution :
| \[e=-L\frac{di}{dt}\] |
| \[e\propto \]Rate of change of current as \[t=0\]to \[t=a\] |
| \[\frac{di}{dt}=+ve\] and constant |
| \[\therefore \] emf is also constant and \[-ve\] in time \[t=a\]to \[t=T\] |
| \[\frac{di}{dt}=-ve\] and constant so emf is also constant and positive |


You need to login to perform this action.
You will be redirected in
3 sec

