| \[\frac{pV}{RT}\]versus p graph for methane gas at several RT temperatures \[{{T}_{1}},\]\[{{T}_{2}},\]\[{{T}_{3}}\]and \[{{T}_{4}}\]are as shown below. |
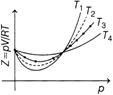 |
| Now, choose the correct option. |
A) \[{{T}_{1}}={{T}_{2}}={{T}_{3}}={{T}_{4}}\]
B) \[{{T}_{1}}<{{T}_{2}}<{{T}_{3}}<{{T}_{4}}\]
C) \[{{T}_{1}}>{{T}_{2}}>{{T}_{3}}>{{T}_{4}}\]
D) Data insufficient
Correct Answer: B
Solution :
At low pressure and at high temperature the compressibility coefficient \[=\frac{pV}{RT},\]is always equal to one for even real gases. But at high pressures and low temperatures gases begun to deviate from ideal gas behaviour. So, \[{{T}_{4}}\] greatest and \[{{T}_{1}}\]is least temperature.


You need to login to perform this action.
You will be redirected in
3 sec

