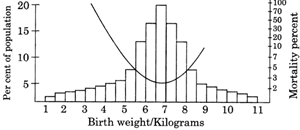
| The diagram below represents the proportions of a population of newborn deer calves falling into various birth weight classes. The graph superimposed on the diagram represents mortality in relation to birth weight. |
 |
| From the information given which one of the following interpretations is correct? |
A) Birth weight is undergoing stabilising selection
B) Birth weight is an example of discontinuous variation
C) Birth weight is inversely proportional to mortality
D) Birth weight is genetically linked to mortality
Correct Answer: A
Solution :
The diagram and graph show that new born deer calves that fall within the 6-8 kg range have the lowest mortality. This results in stabilizing selection, where a selection pressure towards a particular range exists.


You need to login to perform this action.
You will be redirected in
3 sec

