| The given graph represents the variation of compressibility factor\[(Z)=\frac{pV}{nRT},\] for three real gases A, B and C. Identify the only incorrect statement. |
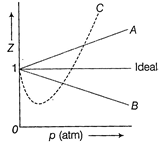 |
A) For the gas A, \[a=0\] and its dependence on p is linear at all pressure
B) For the gas B, \[b=0\] and its dependence on p is linear at all pressure
C) For the gas C, which is typical real gas for which neither a nor\[b=0\]. By knowing the minima and point of the intersection, with \[Z=1,\]a and b can be calculated
D) At high pressure, the slope is positive for all real gases
Correct Answer: B
Solution :
| From the graph, it is clear that the value of Z decreases with increase of pressure. We can explain this on the basis of van der Waals' equation. At high pressure, when 'p 'is large, V will be small and one cannot ignore ' b' in comparison to V. However, the term \[\frac{a}{{{V}^{2}}}\] may be considered negligible in comparison to ' p' in van der Waals' equation. |
| \[\left( p+\frac{a}{{{V}^{2}}} \right)\left( V-b \right)=nRT\] |
| \[p\left( V-b \right)=nRT\] \[\Rightarrow pV-pb=nRT\] or \[\frac{pV}{nRT}=1+\frac{pb}{nRT}\] or \[Z=1+\frac{pb}{nRT}\] |
| Thus, Z is greater than 1. As pressure is increased (at constant T), the factor \[\frac{pb}{nRT}\]increases. This explains why after minima in the curves, Z increases continuously with pressure. Hence, the only incorrect statement is [b]. |


You need to login to perform this action.
You will be redirected in
3 sec

