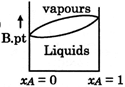
A)

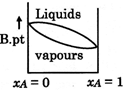
B)
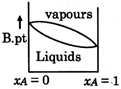
C)
D)
Correct Answer: D
Solution :
[D]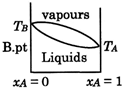 \[\to \]Liquid which is more volatile have less boiling point \[\to \]At higher temperature vapour phase exist in place of liquid


You need to login to perform this action.
You will be redirected in
3 sec

