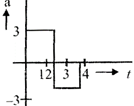
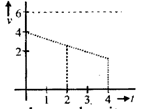
| A particle starts from rest at t = 0 and undergoes an acceleration a in m s~2 with time (in seconds which is shown in figure. Which one of the following plot represents velocity v in \[m{{s}^{-1}}\text{ }verus\]time t sec? |
 |
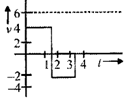
A)
B)
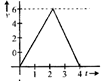
C)
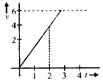
D)
Correct Answer: A
Solution :
| From \[a-t\]graph we observe that |
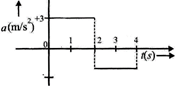 |
| For \[t=0\operatorname{s}\,to\,t=2\,\operatorname{s};\]a is positive i.e., a>0. |
| So, v-t graph will be a straight line with positive slope. For \[t=2s\] to \[t=4s,\] a is negative (a<0), so v-t graph will be a straight line with negative sope. Complete v-t graph will be; |
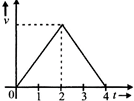 |
| We can also verify that, velocity at \[\operatorname{t}=2s\] |
| =Area under (a-t) graph for \[t=0\,\operatorname{to}\,t=2s\,\] |
| \[=3\times 2=6m/s\] |
| \[\therefore v=6m/s\] |


You need to login to perform this action.
You will be redirected in
3 sec

