| Direction: Following bar graph represents the sale of refrigerator sets in a showroom during first 6 months of the year. |
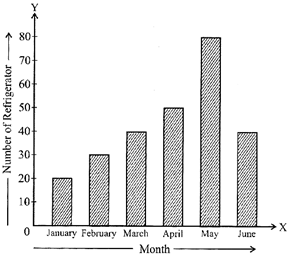 |
| Read the bar graph and answer the following questions: |
A) March
B) April
C) June
D) February
E) None of these
Correct Answer: B


You need to login to perform this action.
You will be redirected in
3 sec

