| Following pie chart represents food items preferred by 21600 people in a survey. |
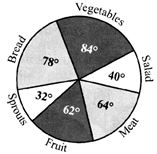 |
| Find the difference between the numbers of people preferring bread and salad. |
A) 2260
B) 2280
C) 2298
D) 2320
E) None of these
Correct Answer: B
Solution :
Not Available


You need to login to perform this action.
You will be redirected in
3 sec

