| Given below is a bar graph showing the number of cars produced in a factory during the first five months of a year. |
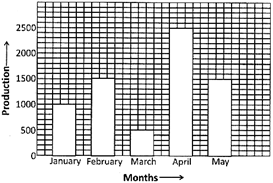 |
| How many more cars were produced in the month of may in comparison to January? |
A) 1000
B) 1200
C) 500
D) 1500
E) None of these
Correct Answer: C
Solution :
Not Available


You need to login to perform this action.
You will be redirected in
3 sec

