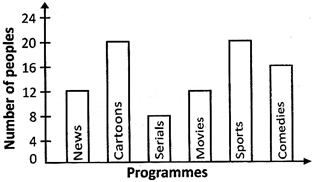
| Directions: Following barograph shows the favorite TV programmers of people. See the graph and answer the following questions. |
 |
A) 16
B) 18
C) 19
D) 20
E) None of these
Correct Answer: D


You need to login to perform this action.
You will be redirected in
3 sec

