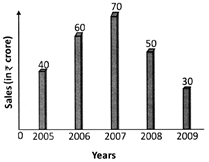
| Directions : The total sales of a company (in crores) of different years are given in the following bar graph. Study the bar graph carefully and answer the following questions. |
 |
A) 6 : 7
B) 4 : 3
C) 6 : 5
D) 7 : 3
E) None of these
Correct Answer: B
Solution :
Not Available


You need to login to perform this action.
You will be redirected in
3 sec

