| Directions: Study the following graph carefully and answer the questions given below. |
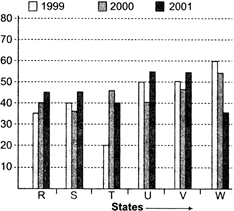
| Production of Rice in 6 states in 1999, 2000 and 2001 |
 |
A) 75%
B) 90%
C) 125%
D) None of these
Correct Answer: D
Solution :
Total production in 3 yr in, State \[R=35+40+45=120\] State \[W=60+50+40=150\] Required percentage \[=\frac{120}{150}\times 100=80%\]


You need to login to perform this action.
You will be redirected in
3 sec

